
Common Mistakes in Fire Hydrant Flow Testing and How to Avoid Them (NFPA 291)

Fire hydrant flow testing is supposed to deliver one clean number: the water supply actually available for firefighting and design. In practice, a handful of repeatable field errors turn that number into fiction. Wrong hydrant layout, an inadequate static-to-residual drop, a misapplied coefficient of discharge, or an uncalibrated gauge all feed the same discharge equation—Q = 29.84 c d² √p—and quietly inflate or deflate the result. Once those bad figures are accepted as available fire flow at the industry-standard 20 psi residual, they cascade into undersized sprinkler systems, failed inspections, and incorrect ISO ratings.
NFPA 291 exists precisely to stop that cascade. It requires at least two hydrants, places the residual gauge between the flow point and the supply, demands a meaningful pressure drop (now 10 percent), and ties every outlet shape to a specific C value. Ignore any of those rules and the test no longer measures the main—it measures the tester’s shortcuts. The sections that follow isolate each common mistake, show exactly how it corrupts the data, and give the NFPA 291-aligned correction so the next test produces numbers you can defend in design reviews and insurance audits.
Why Flow-Test Errors Cascade Into Flawed Sprinkler Designs and ISO Ratings
Those shortcuts do not stay on the clipboard. Every pressure reading and discharge coefficient feeds the same supply curve that hydraulic software, plan reviewers, and insurers treat as ground truth. When the field data are wrong, the entire curve shifts—and the available fire flow (AFF) reported at the industry-standard residual of 20 psi moves with it. That single extrapolated number is what sprinkler designers use to size mains, pumps, and demand; inflate it and the system is under-protected, deflate it and the owner pays for unnecessary capacity.
ISO grading, municipal hydrant marking, and authority-having-jurisdiction acceptance all rest on the identical three pressures—static, residual, and pitot—and the flow derived from them. One flawed test can therefore trigger a cascade: redesigns after plan review, failed acceptance inspections, color-code errors that mislead responding companies, or rating penalties that raise insurance costs for years. The 20 psi residual benchmark exists precisely to keep residual pressure high enough to protect the distribution system and prevent backflow; any distortion of the test data undermines that safeguard as well.
Once crews see that a single missed 10 percent drop or an incorrect outlet coefficient can rewrite the supply curve used for life-safety calculations, the motivation to follow NFPA 291 layout and documentation rules becomes self-evident. The mistakes that follow are not abstract; each one is a direct path to an AFF figure no one can stand behind.
Two-Hydrant Minimums and Residual Placement Errors That Invalidate Supply Data
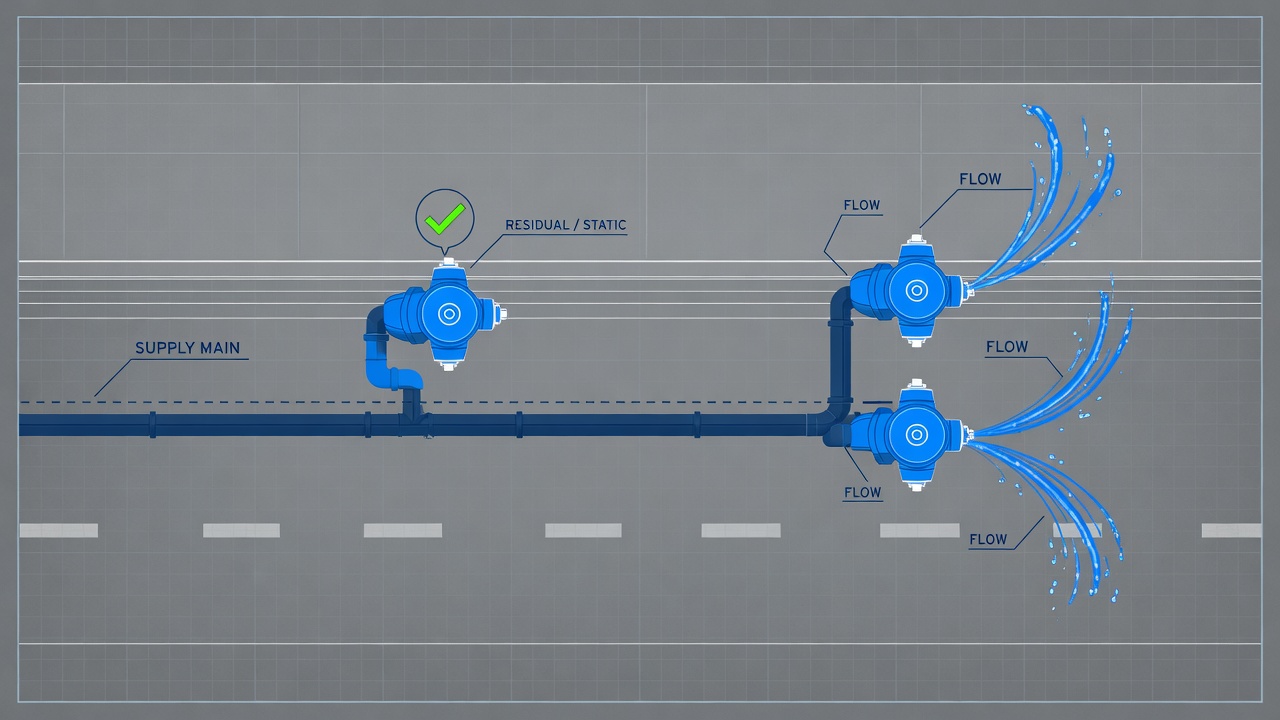
Those paths start with the most basic field decision: how many hydrants you open and where you seat the residual gauge. Single-hydrant tests are simply not valid. At a minimum, flow testing requires at least two hydrants to collect accurate results and determine the available water supply in a water main—one kept closed for static and residual readings, the other (or others) opened to discharge. NFPA and AWWA both reject the one-hydrant shortcut because it never isolates true main supply; it only records the local hydraulics of that single barrel and outlet. The number that later appears in the Q = 29.84 c d² √p equation and the available-fire-flow value at 20 psi is therefore already detached from the system that designers and ISO raters actually need.
Even with two or more hydrants in play, placement can still ruin the data. The static/residual hydrant must sit between the flow hydrant(s) and the large mains feeding the area. Reverse the order and the residual gauge ends up downstream of the draw. It then samples a different—and frequently more optimistic—pressure zone that does not represent conditions at the intended design point. The supply curve shifts, the 20 psi intercept moves, and every subsequent sprinkler calculation inherits the error.
The number of flow hydrants required is not fixed; it scales with the strength of the mains. Weak or small mains often produce a usable residual drop with only one or two flow outlets. Strong, large systems may need as many as eight flow hydrants before residual pressure moves enough to define a realistic curve. Too little discharge leaves residual almost unchanged, forcing either an unreliable extrapolation or a retest.
The corrective habit is straightforward and must precede any valve movement. Sketch the direction of supply on a simple site map, locate the residual hydrant on the supply side of every flow outlet, and keep adding discharge ports until residual movement is clear and measurable. That single pre-test sketch eliminates the layout mistakes that most often invalidate the entire test before a single pitot reading is taken.
Why Your Residual Drop Must Hit 10%: Enforcing the NFPA 291 Threshold
Once the layout is locked in and residual movement starts to appear, the next discipline is making sure that movement is large enough to matter. Even a clean two-hydrant setup fails if the residual barely budges. A drop of only a few psi leaves the test sitting on the flat part of the water-supply curve, so the later extrapolation to available fire flow at 20 psi becomes unrealistically high and the whole data set is useless for design or ISO work.
NFPA 291 (2022) therefore calls for flowing enough water to produce at least a 10% drop from static to residual pressure. Earlier editions required 25%, so crews still operating on legacy habits often under-flow strong systems and stop short of a usable reading. The current 10% threshold is the minimum that keeps the test on the steeper, more reliable portion of the curve while still remaining practical in the field.
What to do when the first run falls short
If the residual drop is inadequate, open additional outlets on the same hydrant or bring more flow hydrants online and repeat the test until the 10% threshold—or the actual firefighting demand—is clearly met. Never accept a “close enough” reading; the few extra minutes spent adding discharge capacity prevent an inflated fire-flow number that will later mis-size sprinklers or trigger an ISO penalty.
Record both the static and residual pressures on the same gauge train so the percentage itself is defensible. Switching gauges or relying on separate instruments introduces calibration scatter that can erase a borderline 10% drop and leave the test open to challenge.
| Static (psi) | Residual (psi) | Drop | Verdict |
|---|---|---|---|
| 80 | 70 | 12.5% | Accept—proceed to pitot readings |
| 80 | 74 | 7.5% | Reject—add outlets and retest |
| 65 | 58 | 10.8% | Accept—minimum threshold met |
| 65 | 62 | 4.6% | Reject—curve still too flat |
Treat the 10% rule as non-negotiable gatekeeping: once residual movement is both correctly placed and large enough, the pressures you hand to the discharge formula are finally trustworthy.
Coefficient and Pitot Errors That Skew the Discharge Formula

With residual movement correctly placed and large enough, the pressures you hand forward are finally usable—but only if the discharge calculation itself is clean. The governing equation is straightforward: Q = 29.84 c d² √p, where Q is flow in gpm, c is the coefficient of discharge, d is the outlet diameter in inches, and p is the pitot pressure in psi. An incorrect c or an extreme pitot reading scales every subsequent available-fire-flow figure and every sprinkler demand that depends on it.
Guessing the coefficient is the fastest way to corrupt total flow. Match c to the actual outlet geometry before you open anything: use 0.90 for rounded outlets, 0.80 for square outlets, and 0.70 for projecting outlets. When a stream straightener is fitted on the butt, raise the coefficient to 0.95. These values are not interchangeable; swapping a rounded coefficient onto a square butt alone can shift calculated discharge by more than ten percent and push the entire water-supply curve into the wrong place.
Pitot pressure compounds the problem. Readings below 10 psi or above 30 psi magnify both measurement uncertainty and any residual error in the coefficient. At those extremes the square-root term becomes hypersensitive, so small gauge wobble or a slightly off centerline reading turns into large swings in Q. Whenever possible, keep pitot inside the 10–30 psi band.
Practical fixes before the first valve turns
Identify the butt type and verify the nozzle diameter on every flowing outlet before the test begins. If the predicted pitot will land outside the preferred band, add or remove outlets—or move to additional flow hydrants—until the expected pressure sits comfortably between 10 and 30 psi. Record the coefficient actually applied for each outlet so the math can be audited later. When c, d, and p are all disciplined, the formula finally returns a discharge number the residual drop and the 20 psi available-fire-flow calculation can trust.
Uncalibrated Gauges, Skipped Inspections, Elevation Gaps, and Water Hammer
Even when coefficients, diameters, and pitot readings are locked down, the pressures that feed Q = 29.84 c d² √p—and the residual drop that anchors available fire flow at 20 psi—still hinge on instruments and field habits crews often treat as afterthoughts. Uncalibrated gauges, skipped hydrant inspections, unrecorded elevation differentials, and water hammer from abrupt valve operation silently shift every reported number. Each one moves the supply curve without anyone noticing until the sprinkler design or ISO review fails.
All pressure gauges must be calibrated at least once every year. An out-of-date gauge invalidates static, residual, and pitot readings alike, so the entire test becomes unusable for design or rating work. Before any water moves, inspect the hydrants themselves. Starting a test on damaged stems, leaking outlets, rusted caps, or debris-choked barrels is one of the most common mistakes; restricted discharge produces artificially low pitot pressures and understated flows that no amount of later math can repair.
When the valves finally turn, open and close them slowly. Sudden operation creates water hammer and pressure surges that can crack mains, damage services, and throw residual readings into chaos. Finally, note the elevation difference between the residual hydrant and each flow hydrant so every pressure can be corrected to a common datum; an unrecorded grade change of even a few feet introduces a permanent offset into the 20 psi available-fire-flow calculation. Treat gauges, hydrants, valve speed, and elevation as non-negotiable controls and the discharge number that leaves the field will finally match the hydraulic reality the next designer or ISO rater needs.
Incomplete Documentation, Misapplied Color Codes, and Skipped Five-Year Retests
Field results can only be as good as the paperwork that carries them forward. Incomplete documentation turns even a carefully executed two-hydrant test into data that designers and ISO reviewers should reject on sight. Watch for reports that omit any of the three pressures—static, residual, or pitot/flow—or that lack date, location, elevation differential, outlet diameter and coefficient, and weather notes. A sheet that shows only static and one flowing pressure is incomplete; without the full set, no one can reconstruct Q = 29.84 c d² √p or defend the available fire flow at 20 psi residual.
Those same numbers determine the hydrant’s NFPA 291 color coding on the bonnet and caps, which tells responding crews what capacity they can expect at 20 psi residual: blue for 1,500 gpm or greater, green for 1,000–1,499 gpm, orange for 500–999 gpm, and red for less than 500 gpm. Feed the formula bad static, residual, or pitot values and the painted colors become fiction—crews arrive expecting a blue hydrant and find a weak orange instead. That gap is not cosmetic; it is a field safety failure rooted in the same measurement errors already discussed.
Public fire hydrants should be flow tested every five years to verify both capacity and marking and to give utilities a trend line rather than a single snapshot. Skipping the retest leaves color codes frozen to outdated supply conditions and erases the chance to catch gradual main deterioration before the next design or ISO review. Standardized worksheets that force entry of every pressure, coefficient, elevation, and outlet detail—plus simple photo evidence of gauge faces and hydrant layout—close the loop between the street and the sprinkler calculation. When the field package is complete, the discharge number that left the hydrant remains usable; when it is not, the entire supply curve collapses into an expensive unknown.
The Field Checklist That Keeps Every NFPA 291 Test Defensible
That complete field package only holds if every procedural fix from layout through documentation is actually executed on the street. The practical way to lock it in is a single run-through checklist crews can walk before the first valve turns, while water is moving, and after the last gauge is bagged. Treat any failed item as an automatic retest trigger—not a note to file later.
Pre-test
- Inspect every hydrant for damage, leaks, debris, and operable valves; clear or tag out anything compromised.
- Sketch supply direction and place the residual/static hydrant between the supply mains and the flow unit(s)—never a single-hydrant setup.
- Verify gauge calibration dates (annual minimum) and confirm the same gauge train will read both static and residual.
- Identify each outlet type and assign the correct discharge coefficient before anything opens.
- Note elevation differences and choose a common datum; stage diffusers to control discharge safely.
During the test
- Open and close hydrants slowly to avoid water hammer.
- Flow enough outlets or hydrants to produce at least a 10 % drop from static to residual; add capacity if the drop stays flat.
- Keep pitot readings inside the 10–30 psi band when feasible; adjust outlet count rather than force an extreme scale.
- Record static, residual, and pitot pressures plus elevation on the spot—no memory work later.
Post-test
- Complete the full standardized worksheet: date, locations, all three pressures, coefficients, diameters, elevations, weather, and photos of gauges and layout.
- Compute discharge with Q = 29.84 c d² √p using the verified C values, then derive available fire flow at 20 psi residual.
- Update the hydrant color marking only if the new AFF justifies it; schedule the next five-year retest and log the due date.
Run the list in order. When every box is checked, the supply curve that leaves the street is the same curve the sprinkler designer and the ISO rater will trust. When any box fails, stop, correct, and retest—because the only number that matters is the one that survives disciplined verification.